Digitalization will transform the way you work
It might sound odd coming from a software company – but changing your processes from paper to digital forms isn’t in and of itself that useful. Yes...
![]() Facilities Management
Facilities Management
Manage maintenance requests & streamline operations
CMMS
CAFM
EHS
Regulatory Compliance
PPM
EAM
Operations Management
Transportation Management
![]() Food Safety
Food Safety
Prove compliance and ensure standards are up to customer expectations
![]() Retail Task Management
Retail Task Management
Enable your teams to focus on delivering quality and achieve their goals.
Task Creation & Automated Follow-up
Unified Reporting and Data Analysis
Regulatory and Audit Monitoring
Full visibility of every task
IoT
Take action on your data to get ahead
Integrations
Bring mpro5 into your other tools
Automated Workflows
Make your work effortless with automated workflows
Managed Service
Supporting your operations, every step of the way
NEWS & INSIGHTS
Blogs & news
NEWS & INSIGHTS
GET IN TOUCH
GET IN TOUCH
3 min read
 Konnor Baskaran
:
Nov 17, 2022 12:00:00 PM
Recently, I was involved in a tender exercise to procure security guarding services, and I couldn’t help noticing something strange. Two out of the three tenders had proposed using, in their ‘Innovation’ section, augmented reality.
I have yet to figure out how exactly this would improve their offerings, so if anyone can explain it to me, please do let me know.
In my experience, innovation proposals are more like blue-sky hypotheticals that will inevitably be ripped out during the final stages of the tender due to the costs, never to be mentioned again.
Innovation is thought of as essential, but it’s often so disconnected from daily operations that it’s conceptual instead of practical; creative but not useful.
Real innovation should deliver benefits, not simply a cost.
So, how do you drive innovation that has a practical benefit to your business?
The answer to that lies in how you handle your data. Hopefully, it’s already working for you, providing relevant information on your operations. But, if your data isn’t structured sensibly, gathered easily and visualised quickly, this hinders your ability to identify where innovation is truly needed.
Innovation, like invention, is about finding a real problem that needs fixing, something tangible that will make a difference.

If you’re spending your day building reports in Excel or PowerPoint, just to confirm all is well, then you probably don’t have the time to see what the data is really telling you, nor use it to identify opportunities for innovation.
Your intuition and experience may already be pointing you in the right direction, but without the data to back it up, it can be hard to make a business case for your proposed solution.
Achieving a far more detailed level of visibility will require some changes to the way your tech stack works. You need to understand how you are currently gathering, structuring and processing your data:
I’m not suggesting you tear down every system you have or remove every data silo in your business, but integration will play a key part in structuring your data. With the right platform, you can link all these disparate data feeds, allowing you to monitor every KPI via a single source.

Setting up these platforms can be complicated, it’s not a magic wand, but in the long run it will simplify your data management and considerably increase operational efficiencies as a result. Standardising your data and finding ways to present it concisely will give you the best chance of seeing your pain points.
Understandably, it’s a daunting project, but not when you consider the hours you probably spend on creating reports for clients and internally.
It might require some untangling of old cables, but with an operational platform that offers more than just data handling, you can replicate various apps you may be using to simplify your tech stack and build integrations where you have already found the perfect tool. This exercise in rationalisation is an efficiency in of itself.
Real-time and easily understood data will allow you to see where the bottlenecks are in your business:
These kinds of questions are a good starting point to identify areas for potential innovations. If you find a blind spot in the business, that is telling you something too!

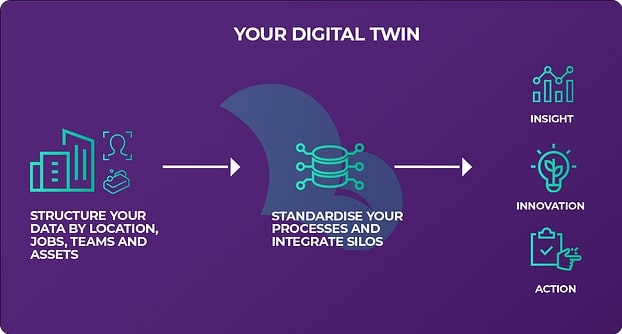
Creating a ‘Digital Twin’ of your sites might sound like the wrong kind of innovation again, but there’s more to it than vanity projects involving spinning 3D building models.
It’s about anchoring your data to your clients, to their sites, their locations, their assets and to the jobs you need to do. In effect, you are laying your processes over a clear structure, so everything has a place, and if something doesn’t get done, it’s not forgotten.
This structure makes it far easier to slice and dice your data, interrogating it for those critical insights – why are you meeting all your KPIs at one site, and not at a similar one across the street? You might see that it’s a particular audit question you’re failing and on the same cleaner’s shift, so a simple training reinforcement session fixes the issue for the long term.
A platform such as ours makes it easy to capture data seamlessly from across your operations and makes reporting straightforward and real-time. This approach is at the core of effective innovation, which finds simple ways to increase efficiency that are otherwise hidden.
-gif.gif?width=553&height=314&name=Smart%20Buildings%20Maintenance%20Dashboard%20GiF%20(1)-gif.gif)
Using a data driven approach means that you can track your management interventions, and judge how successful they were. You can start locally before pushing new best practices out across your wider business.
If you can demonstrate to a client how you use data to identify problems, drive action and improve your standards, you can be sure they won’t ever consider replacing you. Don't hide your poor audit performances; celebrate your proactive, innovative approach to service. Sensible data tells a story worth knowing.
And next time you’re tempted to fill out a tender that promises to give your cleaners access to a digital metaverse of mops or a VR headset for your security teams to wear on patrol, check your data to see if it’s going to deliver your new client a better experience or save them money - that might help you win the job.
It might sound odd coming from a software company – but changing your processes from paper to digital forms isn’t in and of itself that useful. Yes...

How people work has changed significantly over recent years and technology has brought big changes to the workplace. The need to capture accurate...

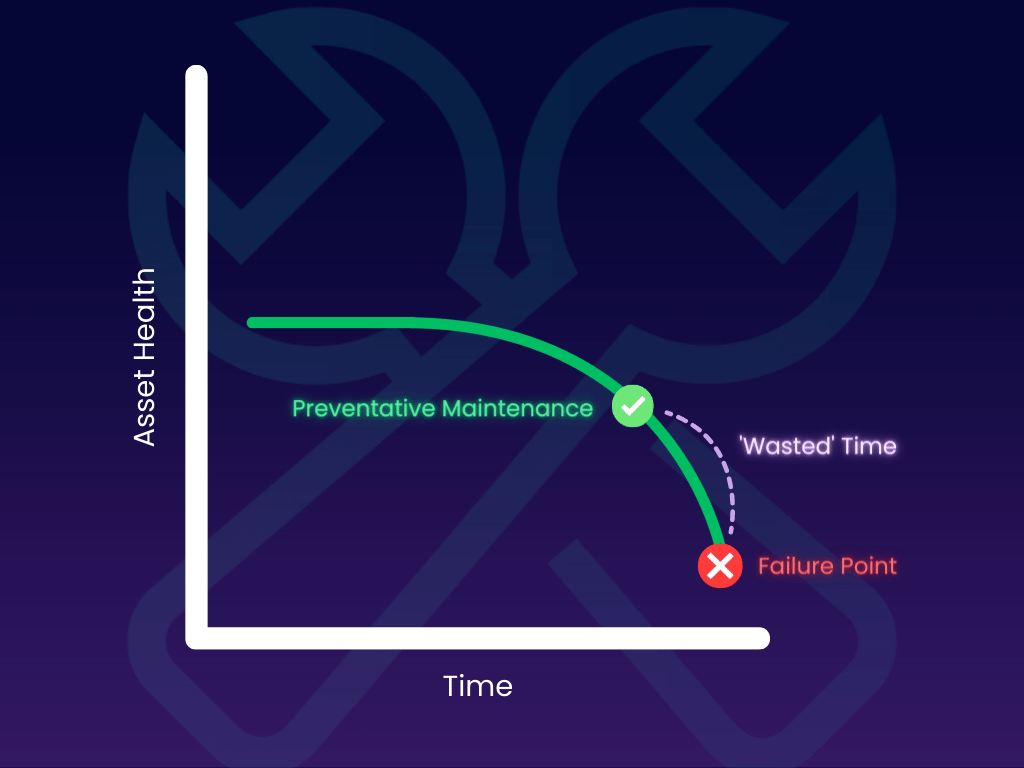
In this blog we will explain what the three main kinds of maintenance are - reactive, preventative and predictive.